Are you exploring strategies to improve the trading outcomes of your options? Understanding market trends and patterns is crucial to achieving consistent success. One key aspect is identifying tools that provide actionable insights for informed decisions.
The best indicator for option trading can help you navigate complex market conditions with confidence. This article explores top indicators to refine your strategies and secure steady gains. Let’s uncover ways to make the most of technical analysis.
P/E Ratio for Understanding Market Sentiment
The Price to Earnings Ratio (P/E Ratio) offers insights into the underlying sentiment of the market. It helps traders assess the valuation of the underlying asset associated with their options. A lower ratio may indicate undervaluation, providing a potential buying opportunity, while a higher ratio might signal overvaluation and caution. Using the P/E Ratio ensures that your trades are informed by a balance of technical and fundamental analysis. By combining the P/E Ratio with technical indicators, you create a well-rounded strategy that accounts for both market trends and sentiment.
Moving Averages for Trend Clarity
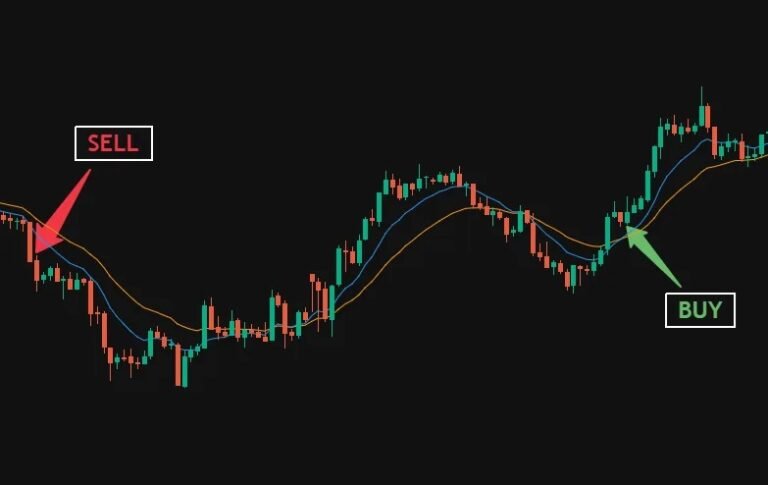
Moving averages are foundational tools for analyzing price trends in the market. They smooth out fluctuations, providing a clearer picture of long-term and short-term movements. These indicators work by averaging past prices and helping traders identify potential entry and exit points. When combined with other indicators, they offer a powerful strategy for options trading. Many experienced traders use multiple moving averages, such as short-term and long-term averages, for deeper insights.
Relative Strength Index (RSI) for Momentum Insights
Momentum is a critical factor in trading, and RSI is a valuable tool for measuring it. Traders use it to identify opportunities when a trend might slow or change direction. Incorporating RSI into your strategy allows for better trade timing and improved decision-making. For options trading, combining RSI with tools like moving averages enhances the precision of market predictions.
Bollinger Bands for Market Volatility
Bollinger Bands are highly effective for understanding market volatility and identifying potential price breakouts. These bands adjust dynamically to price movements, showing whether an asset is trading within a typical range or moving toward extremes. Traders often rely on Bollinger Bands to anticipate significant price shifts, making them essential for options trading strategies. When prices approach the upper band, the market may be overbought; conversely, the lower band might signal oversold conditions. Combining Bollinger Bands with indicators like RSI provides a layered analysis that enhances decision-making.
MACD for Timing Precision
The Moving Average Convergence Divergence (MACD) indicator is a reliable tool for identifying changes in momentum and potential trend reversals. It analyzes the relationship between two moving averages and generates signals that traders use to time their trades effectively. The histogram in MACD adds another layer of insight, showing the strength of momentum changes. Traders often use MACD in conjunction with other indicators, such as Bollinger Bands, to validate signals and reduce risks.
Volume Analysis for Enhanced Confirmation
Volume is an often-overlooked yet critical component of technical analysis. Analyzing trading volume provides insights into the strength and sustainability of a trend. High volume during a price increase suggests strong interest and momentum, while low volume might indicate a weak trend. For options trading, volume analysis is particularly useful for confirming breakouts or reversals. Combining volume data with other indicators like MACD or RSI can enhance the reliability of your trading strategy.
Using the best indicator for option trading is essential for making informed and profitable decisions. Incorporate a variety of tools, such as RSI, Price to Earnings Ratio (P/E Ratio), Bollinger Bands, MACD, and volume analysis, for a well-rounded strategy. Combining these indicators ensures you adapt to market conditions effectively, enhancing both precision and confidence. With consistent practice and refinement, these tools will help you achieve consistent profits in options trading. Leverage technical analysis to stay ahead of the market and achieve your trading goals.
